- Tham gia
- 4/11/07
- Bài viết
- 14,898
- Được thích
- 37,665
- Donate (Momo)

- Giới tính
- Nam
- Nghề nghiệp
- Consultant
Add a Horizontal Line to a Column or Line Chart: Series Method.
Thêm 1 đường kẻ ngang vào đồ thị.
How do you add a nice horizontal line to a column or line chart, to show a target value, or the series average? The method involves adding a new series, applying it to the secondary axes, and making the secondary axes disappear.
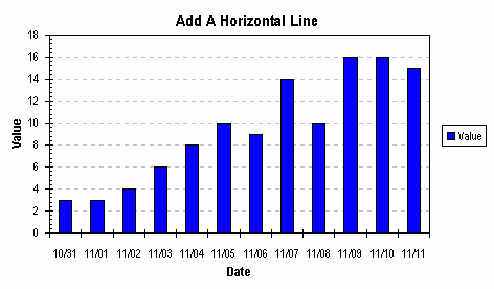
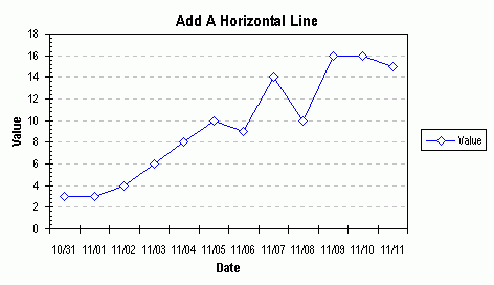
Use this data to make a column or line chart. The blank cell in the upper left of this range tells Excel that "Value" is the series names, and the dates in the first column are the category (X axis) labels. (I use dates in this example, but you could use any type of category labels.)
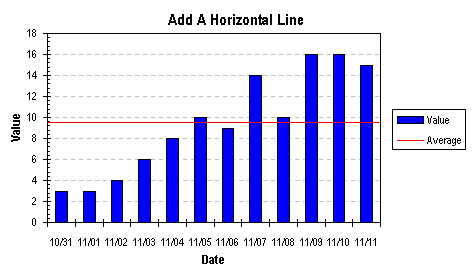
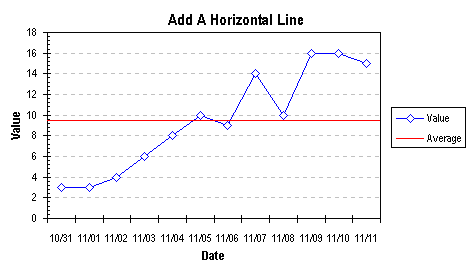
Có cách nào thêm 1 đường kẻ nằm ngang vào 1 đồ thị dạng cột hoặc dạng đường kẻ nhằm đưa vào 1 đường biểu diễn 1 mục tiêu, hay là 1 giá trị trung bình? Ta có thể dùng 1 serie dữ liệu trung bình như sau vào dữ liệu có sẵn, nhưng đường kẻ này không đi ngang qua hết bề ngang đồ thị.
 ---------
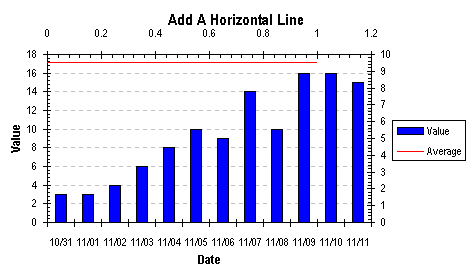
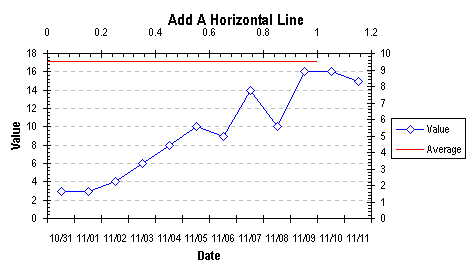
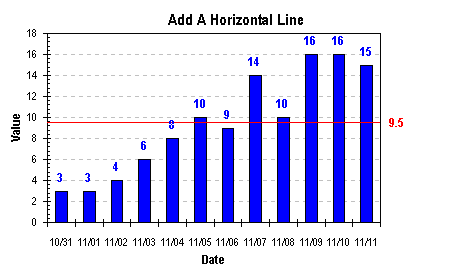
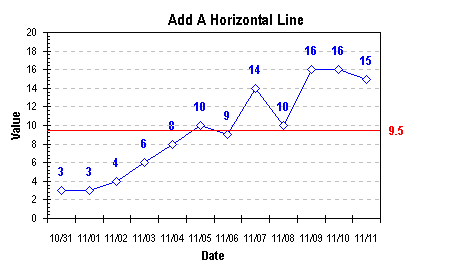
Ta phải dùng cách khác: Thêm vào 1 serie dữ liệu, nhưng dùng trục tung thứ hai, và làm cho trục tung này biến mất. Dùng lại dữ liệu bảng trên, chỉ dùng cột chữ xanh. Ô trống ở trên cùng bên trái nhằm chỉ cho Excel ô Value là tên serie cữ liệu, và cột có giá trị ngày tháng là các giá trị hiện trên trục hoành. Tạo 1 đồ thị dạng cột hay dạng đường kẻ như 2 hình sau:
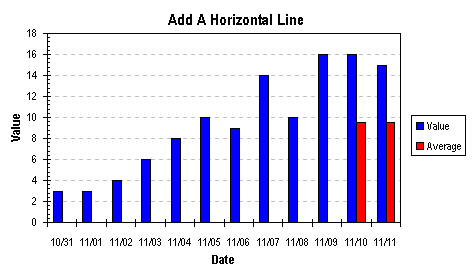
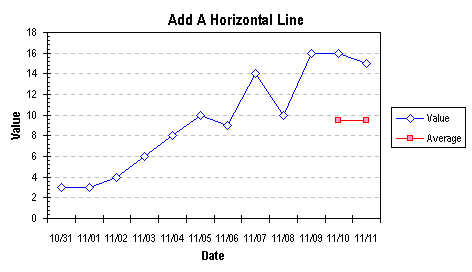
In a free section of your worksheet, set up a range with X and Y values corresponding to the endpoints of your indicator line, shown below. The X value ranges from 0 to 1; we will use the secondary X axis for this line, and scale its min and max to 0 and 1. The Y value corresponds to an average or other significant level you want to indicate on the chart.
Trong 1 vùng trống của sheet, tạo 1 vùng dữ liệu cho các giá trị x và y như bảng dưới, và dùng trục hoành thứ 2 cho nó, trên trục này lấy giá trị nhỏ nhất là 0 và lớn nhất là 1. Giá trị Y là các giá trị trung bình hoặc 1 giá trị nào tuỳ bạn.
|Average
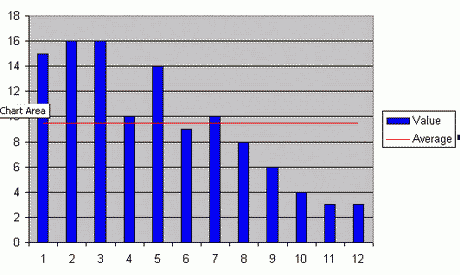
Select and copy this range, select the chart, and from the Edit menu, choose Paste Special. Select the New Series, Categories in First Column, and Series Names in First Row options. The new series has the same style (Column or Line) as the first series.
Chọn và copy vùng dữ liệu này, vào menu Edit, chọn Paste special, chọn new serie, categories in First Coumn và Series Name in First Row. Serie mới này sẽ có cùng dạng biểu đồ cột hoặc đường kẻ với serie trước đó.
Thêm 1 đường kẻ ngang vào đồ thị.
How do you add a nice horizontal line to a column or line chart, to show a target value, or the series average? The method involves adding a new series, applying it to the secondary axes, and making the secondary axes disappear.
Use this data to make a column or line chart. The blank cell in the upper left of this range tells Excel that "Value" is the series names, and the dates in the first column are the category (X axis) labels. (I use dates in this example, but you could use any type of category labels.)
Có cách nào thêm 1 đường kẻ nằm ngang vào 1 đồ thị dạng cột hoặc dạng đường kẻ nhằm đưa vào 1 đường biểu diễn 1 mục tiêu, hay là 1 giá trị trung bình? Ta có thể dùng 1 serie dữ liệu trung bình như sau vào dữ liệu có sẵn, nhưng đường kẻ này không đi ngang qua hết bề ngang đồ thị.
Ta phải dùng cách khác: Thêm vào 1 serie dữ liệu, nhưng dùng trục tung thứ hai, và làm cho trục tung này biến mất. Dùng lại dữ liệu bảng trên, chỉ dùng cột chữ xanh. Ô trống ở trên cùng bên trái nhằm chỉ cho Excel ô Value là tên serie cữ liệu, và cột có giá trị ngày tháng là các giá trị hiện trên trục hoành. Tạo 1 đồ thị dạng cột hay dạng đường kẻ như 2 hình sau:
In a free section of your worksheet, set up a range with X and Y values corresponding to the endpoints of your indicator line, shown below. The X value ranges from 0 to 1; we will use the secondary X axis for this line, and scale its min and max to 0 and 1. The Y value corresponds to an average or other significant level you want to indicate on the chart.
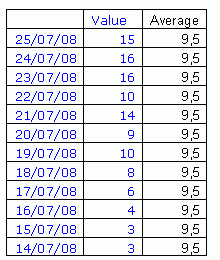
Trong 1 vùng trống của sheet, tạo 1 vùng dữ liệu cho các giá trị x và y như bảng dưới, và dùng trục hoành thứ 2 cho nó, trên trục này lấy giá trị nhỏ nhất là 0 và lớn nhất là 1. Giá trị Y là các giá trị trung bình hoặc 1 giá trị nào tuỳ bạn.
0-|9,5
1-|9,5
Select and copy this range, select the chart, and from the Edit menu, choose Paste Special. Select the New Series, Categories in First Column, and Series Names in First Row options. The new series has the same style (Column or Line) as the first series.
Chọn và copy vùng dữ liệu này, vào menu Edit, chọn Paste special, chọn new serie, categories in First Coumn và Series Name in First Row. Serie mới này sẽ có cùng dạng biểu đồ cột hoặc đường kẻ với serie trước đó.